|
Investigating how interfaces affect the relation between the public and the private the installation “Atmosphere – the sound of CO2” will, as part of COP15 activities in Copenhagen in December, monitor the quantity of CO2 in the air at three different locations in Copenhagen and transform these data into an audiovisual expression that varies in accordance to the measured quantity of CO2.
As such the installation presents itself as both an artwork and as an interface that in a subtle and peripheral way presents to the public information on non-sensuous aspects of the environment. Aspects that relate to private activities like e.g. car driving and heating of houses. From a research perspective the installation relates to interface design/ interface aesthetics, sonification – the auditory equivalence of data visualization, and to a broader philosophical discussion concerning representational vs. computational aspects of space perception.

How it works
Introduction
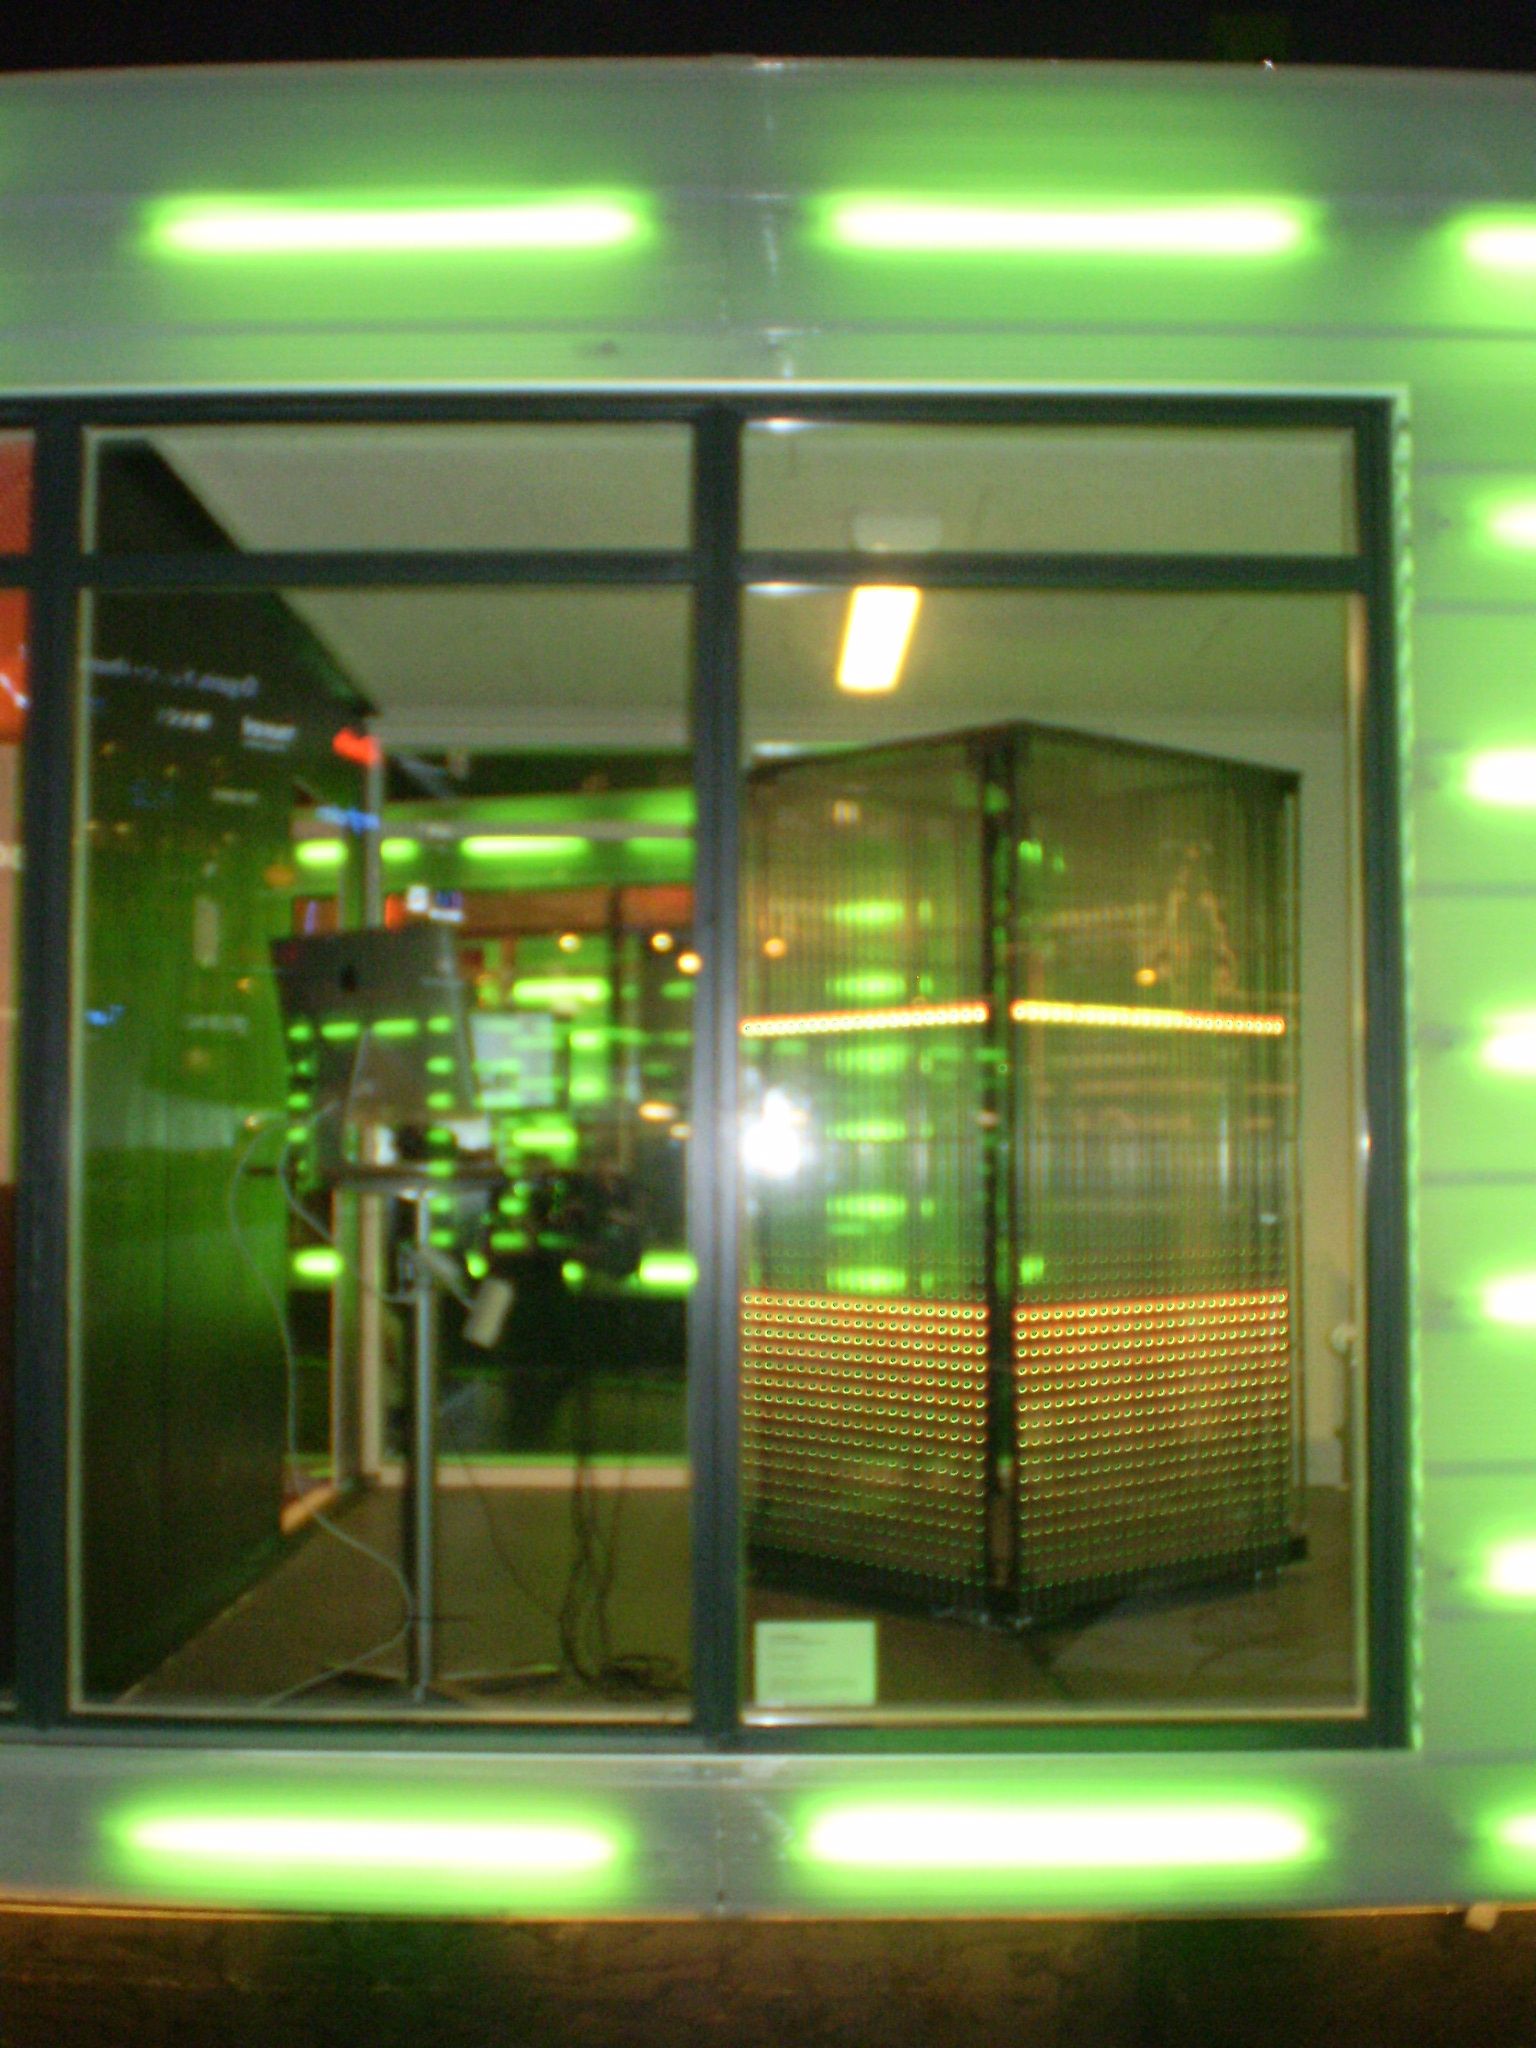
The art installation “Atmosphere – the sound and sight of CO2” measures the amount of CO2 in the air at three different locations in Copenhagen: Rådhuspladsen, Kongens Nytorv and Østre Anlæg. The measured CO2-data is converted into sound and visuals and presented on a 2-meter high, quadrant sculpture that function as a transparent, low resolution LED screen. As such a normally non-sensuous phenomenon suddenly becomes visible and audible.
The sculpture
The sculpture that is placed in front of the City Hall is vertically subdivided into three parts. The top represents the data from Rådhuspladsen, the middle part Kongens Nytorv and the lower part Østre Anlæg.
A blinking pulse represents the amount of CO2 meaning that a high concentration of CO2 at Rådhuspladsen is visualized as a fast blinking pulse at the upper third of the sculpture. Like wise a high concentration at Kongens Nytorv results in a fast blinking pulse in the middle part of the sculpture and so on.
The colour
Following the RGB colour code (Red, Green and Blue) each of the tree locations has their own colour. Rådhuspladsen is red; Kongens Nytorv is green and Østre Anlæg blue. At each moment in time the over all colour of the sculpture is a result of the colours blending from the two locations where the amount of CO2 is highest.
If the sculpture turns yellow then the amount of CO2 is highest at Rådhuspladsen and Kongens Nytorv since red and green blend as yellow. If it turns purple, then we have a combination of red and blue, meaning that the amount of CO2 is highest at Rådhuspladsen and Østre Anlæg. If it turns mint blue the CO2 level is highest at Kongens Nytorv og Østre Anlæg since the colour is a combination of blue and green.
The sound
The sound of the sculpture can be heard through headphones. Like the sculpture itself the frequency range has been subdivided into three frequency bands. The high frequencies represent Rådhuspladsen, the middle range Kongens Nytorv and the bass Østre Anlæg. When the level of CO2 rises it affects the pitch of the current frequency band, and also the tempo of repeating pulses. Furthermore each time a CO2 value changes a short audio and visual glitch emerges, that functions as contrast to the repetitive pulsating drones.
Technology
Atmosphere uses a service called Pachube to host the data that is collected by the CO2 sensors. This provides the possibility to openly share the data with everyone in the world. Using a web-browser you can go to www.pachube.com and follow the constant stream of data from the CO2 sensors in Copenhagen during the weeks of the COP15 conference.
http://www.pachube.com/feeds/3336 – Rådhuspladsen
http://www.pachube.com/feeds/3337 – Kongens Nytorv
http://www.pachube.com/feeds/3338 – Østre Anlæg
You can also follow the feeds on your iPhone using the app called PachubeMon.
Credits
Atmosphere is a joint collaboration between Hopenhagen LIVE and Center for Digital Urban Living, University of Aarhus.
Realisation and idea: Morten Suder Riis, Tobias Ebsen, Rasmus B. Lunding and Morten Breinbjerg.
Center for Digital Urban Living wishes to thank The Royal Danish Academy of Fine Arts and the National Gallery of Denmark
Watch it on youtube: Atmosphere - the sound and sight of CO
Whats a video of an earlier implementation of the installation at the CO2030 conference in Aarhus, marts 2009
http://www.youtube.com/user/digitalurbanliving Tags: CO2 |